
Last updated: 23.04.2026
Icinga and Prometheus are both excellent monitoring solutions. However, the focus of the tools is different.
When it comes to monitoring real-time metrics or short-lived services such as containers, Prometheus is the tool of choice. Icinga is often better suited for large-scale status monitoring of the basic infrastructure. However, both solutions do not have to be contrary to each other, but complementary.
In this article, we will look at how we can integrate both monitoring systems and thus utilize the strengths of both tools. The focus is on the integration of Promtheus in Icinga.
check_prometheus – Integrate Prometheus data into Icinga
With the check_prometheus plugin, metrics and alarms from Prometheus can be monitored directly in Icinga. The plugin offers different functions, depending on which data from Prometheus is required. The simplest is the “Health Check”, which monitors the accessibility of Prometheus:
check_prometheus health --hostname 'prometheus.internal'
OK - Prometheus Server is HealthyWith the “Query Check”, PromQL queries can be executed and transformed into an Icinga-compatible format using threshold values:
check_prometheus query -q 'go_goroutines{job="prometheus"}' -c 40 -w 27
WARNING - 1 Metrics: 0 Critical - 1 Warning - 0 OkIf you have already defined all queries in Prometheus itself as alerts, you can use the “Alert Check” to check the status of the alerts with Icinga.
check_prometheus alert
CRITICAL - 2 Alerts: 1 Firing - 0 Pending - 1 Inactive
 \_[OK] [PrometheusTargetMissing] is inactive
\_[CRITICAL] [PrometheusAlertmanagerJobMissing] - Job: [alertmanager] is firingEach of these checks has many more options and we are actively working on improving the plugin.
Meta monitoring – when monitoring monitors itself
If you run Icinga and Prometheus in parallel, you are using two monitoring solutions at the same time. Ideally, both should be configured so that they look after each other. This practice is often referred to as “meta monitoring”, i.e. monitoring the monitoring system.
To monitor Prometheus with Icinga, we have already learned about “check_prometheus”.
We have developed the “icinga2-exporter” project for monitoring Icinga with Prometheus. The icinga2-exporter is intended for “Icinga Self-Monitoring”, i.e. Icinga instances can be monitored using Prometheus.
For this purpose, the exporter provides an HTTP endpoint with metrics in Prometheus text format. These metrics can then be imported and monitored with Prometheus.
---
global:
  scrape_interval: 30s

scrape_configs:
    - job_name: 'icinga'
      static_configs:
- targets: ['icinga2-exporter.internal:9665']You can also create a fancy Grafana dashboard for Icinga self-monitoring!
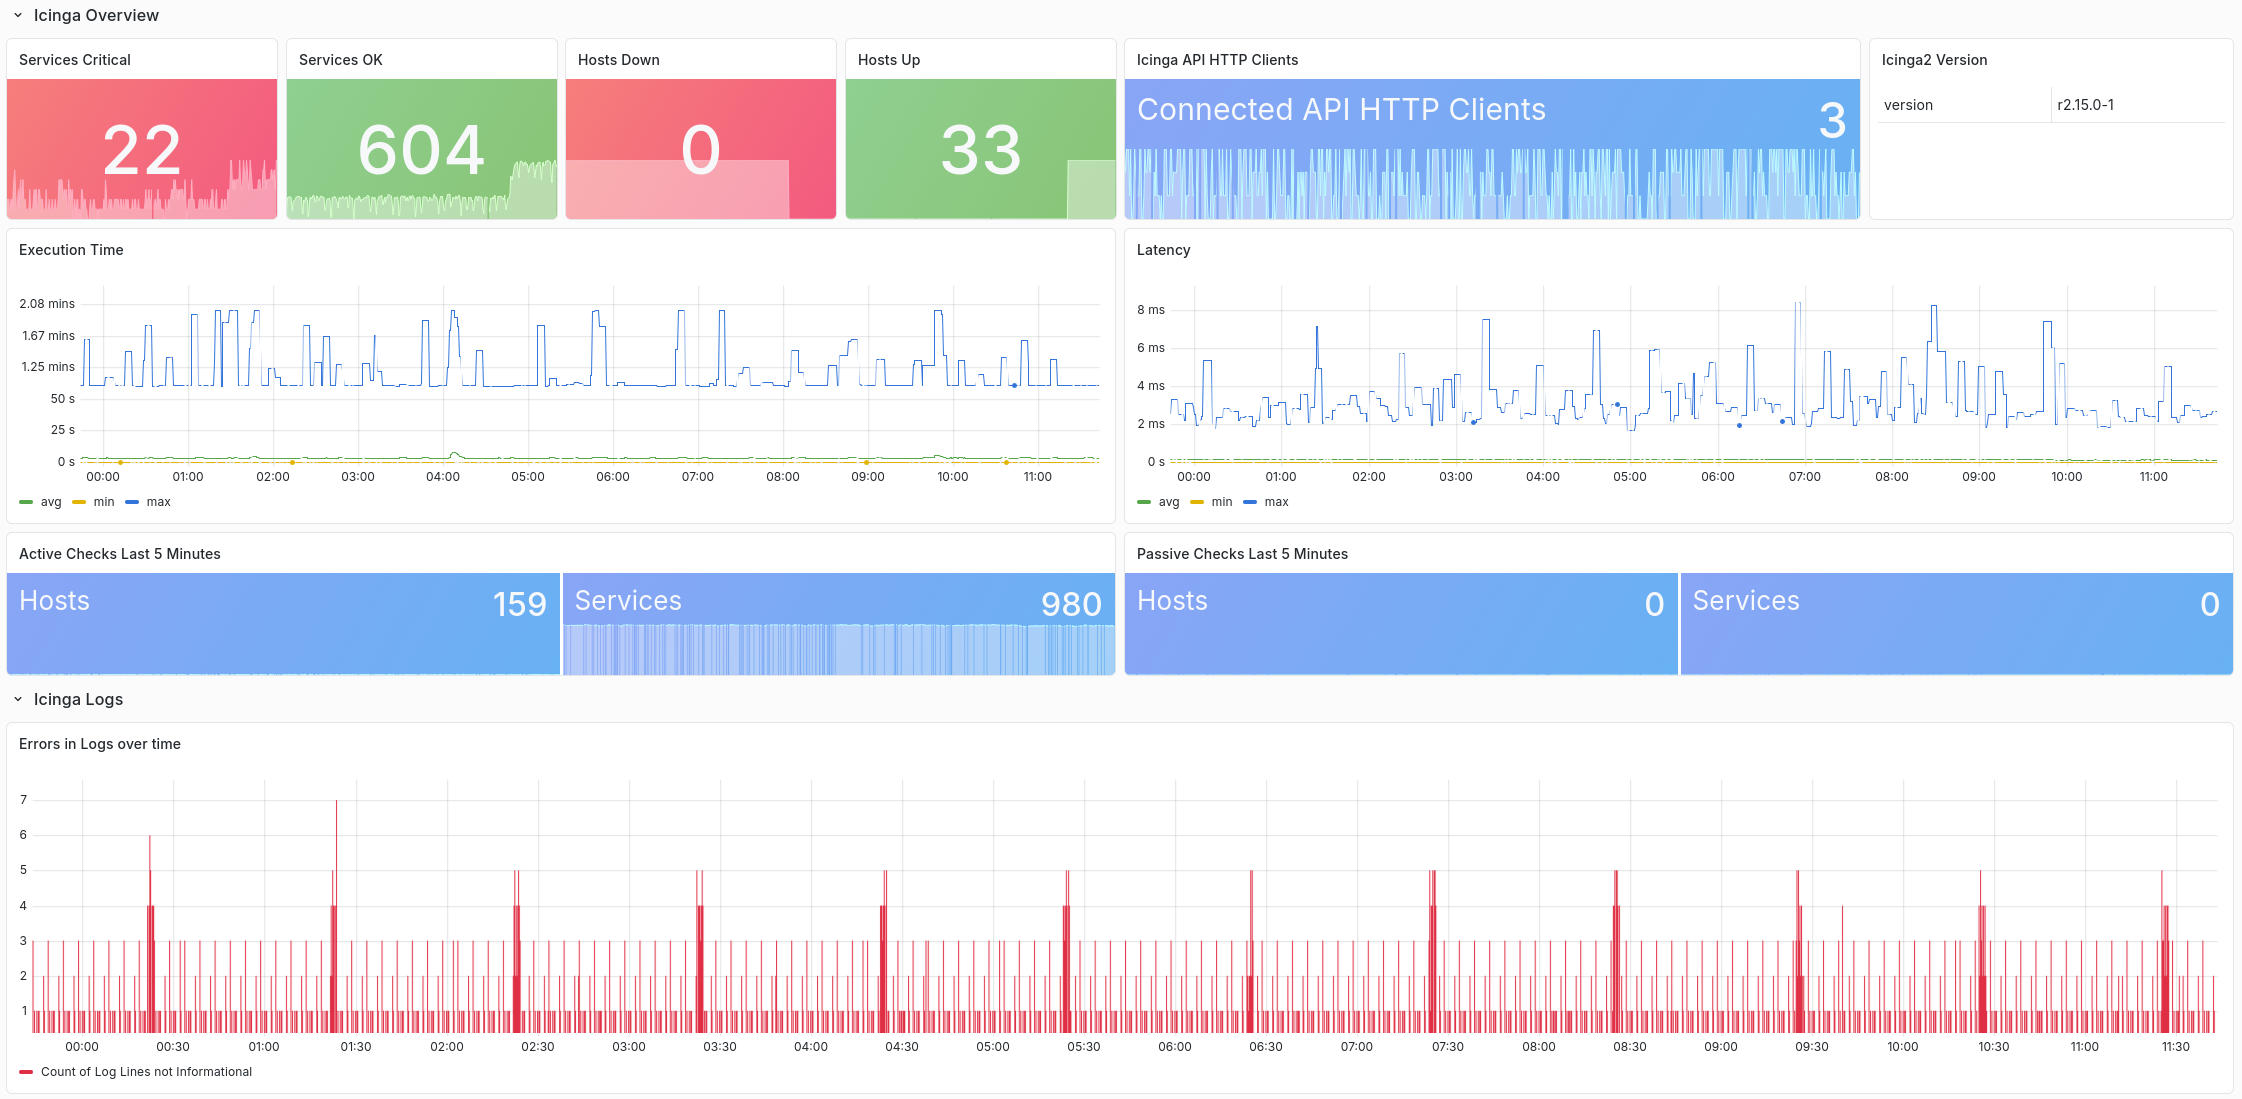
What the icinga2-exporter deliberately does not do is send performance data from Icinga to Prometheus. We will now take a look at this topic.
Icinga performance data and graphs
Anyone running an Icinga instance usually also wants to store the performance data of the check plug-ins for the long term. For this purpose, Icinga provides various “writers” that can write the data to external time series databases.
This often raises the question of which time series database to use. We at NETWAYS are of the opinion that Prometheus is a good solution here. Prometheus is stable, easy to operate and has many compatible alternatives that address issues such as high availability. For example VictoriaMetrics, Cortex, Thanos or Grafana Mimir.
To send data from Icinga to Prometheus, you need at least Icinga release 2.16.0 from 23.04.2026. In version 2.16, the native OpenTelemetry integration called OTLPMetricsWriter(https://github.com/Icinga/icinga2/pull/10685) was merged.
What is OpenTelemetry?
OpenTelemetry is an open standard for telemetry that attempts to standardize different data types (metrics, logs, traces, etc.) and establish a common transmission protocol (OTLP). With the new Writer for Icinga, performance data can be written to Prometheus – and other databases that speak OpenTemetry – using OTLP/HTTP.
Visualize performance data in Icinga Web
If the data is available in Prometheus, check_prometheus can be used again for monitoring. In addition, we have already prepared our Performance Data Graph module for Icinga Web for Prometheus. The perfdatagraphs-prometheus module is available as a backend.
With the now available Icinga version 2.16, we have provided a first release for this module. This makes it possible to use Prometheus as a database for Icinga Performance data and to visualize the data in Icinga Web.
A small note at the end, VictoriaMetrics offers compatible APIs to InfluxDB, for example, so it could already be connected to Icinga today and PromQL (or MetricsQL) could be used. All the solutions presented also work with the VictoriaMetrics Prometheus API.
The projects used at a glance
All tools are open source and available on GitHub:
