Grafana
Visualize and analyze your data sources
Visualization & Analysis
With Grafana, you can combine all your data sources in a single dashboard, customize them and monitor them in real time. Receive notifications in the event of problems and keep an eye on your system at all times – simple, flexible and tailored precisely to your needs.
Grafana features
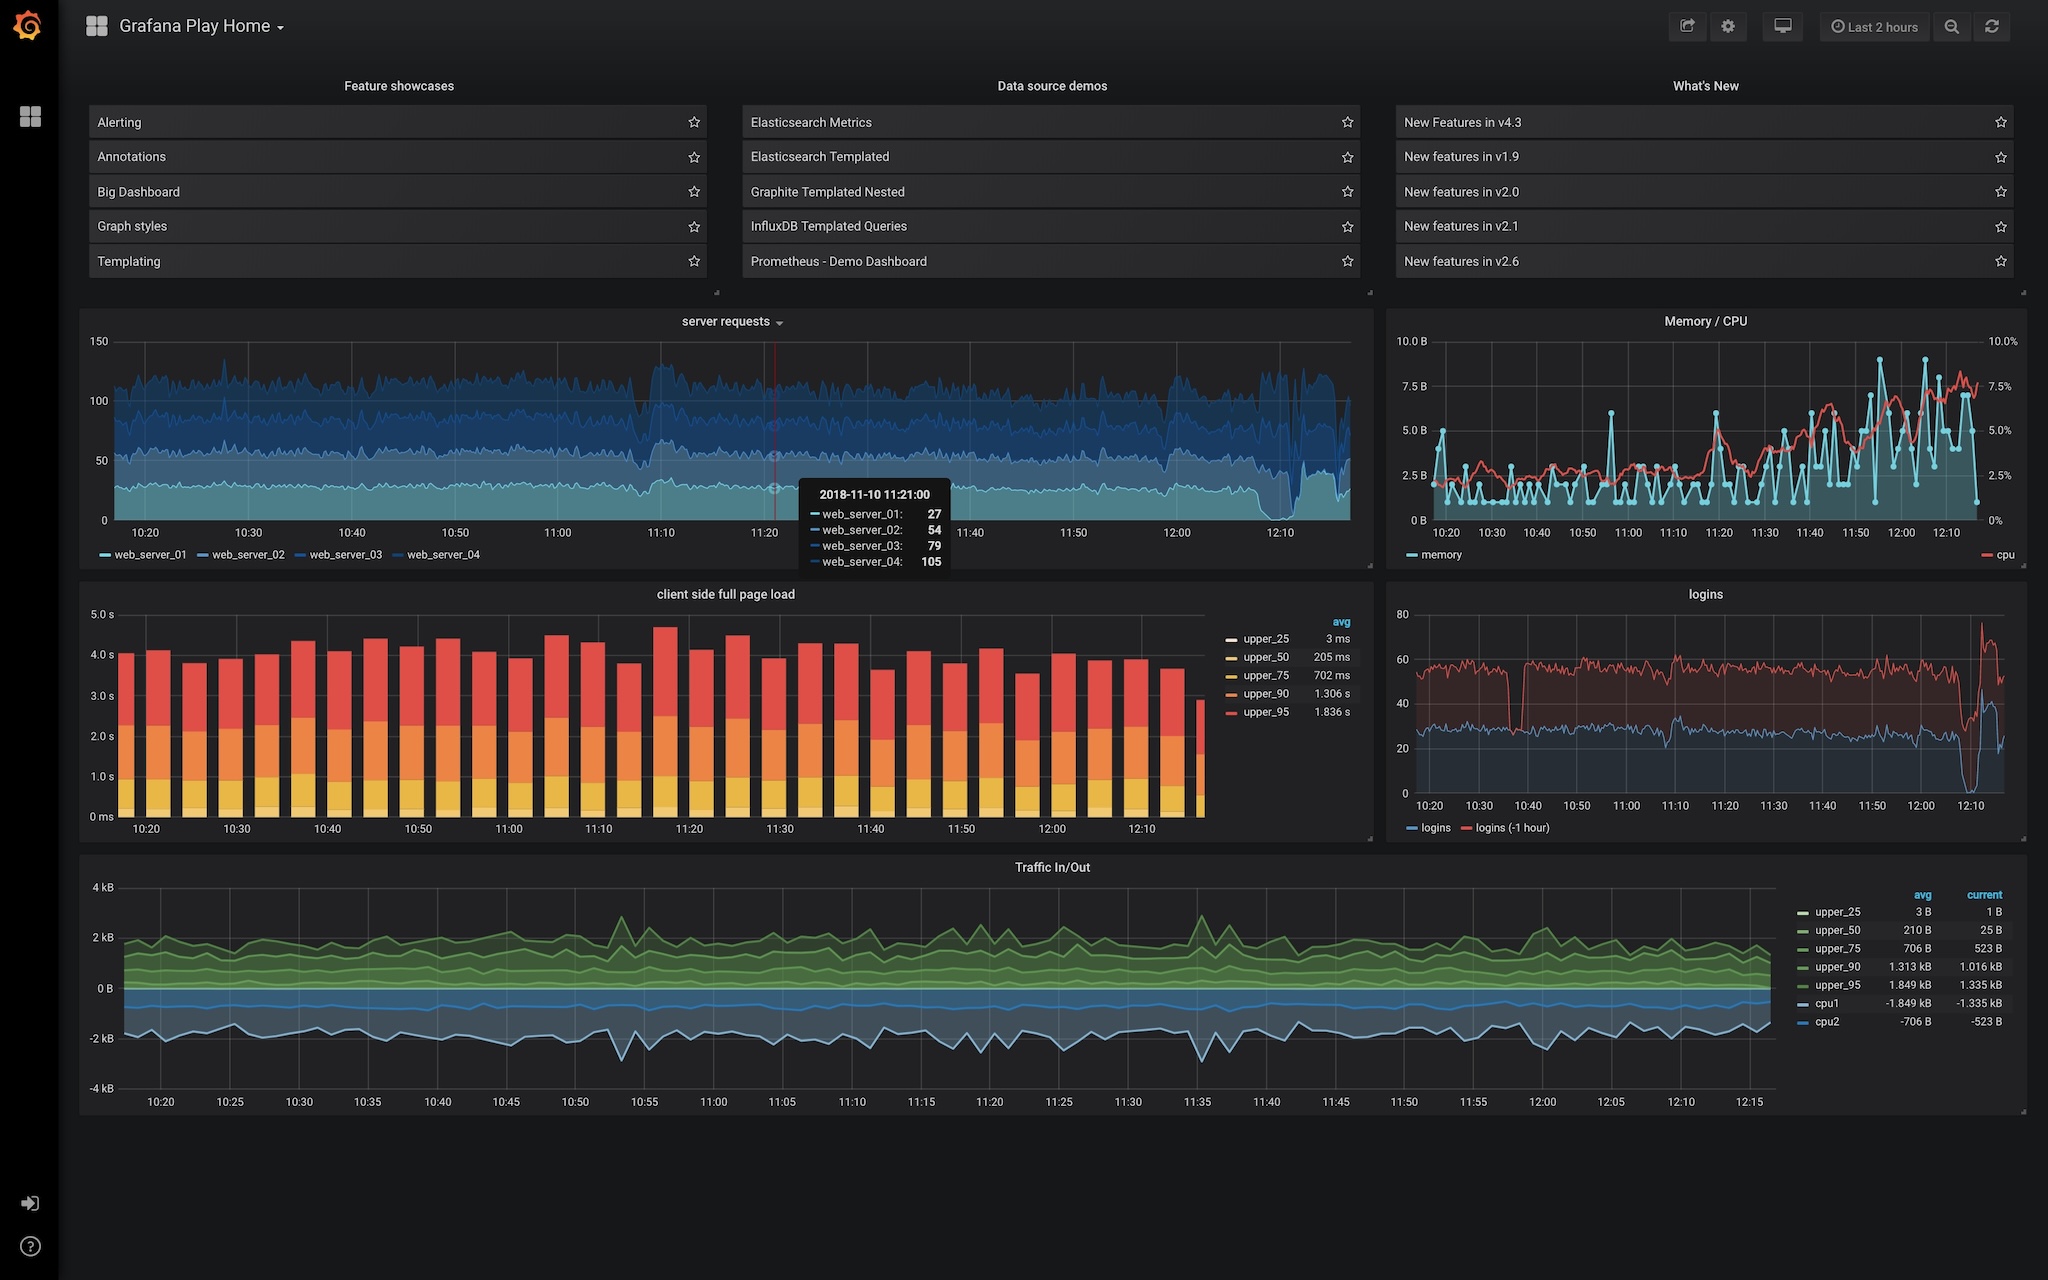
Grafana web interface
The screenshot shows an overview of the Grafana web interface, in which the various components and functions of the dashboard are clearly explained.

Jump quickly between different dashboards.
Log in with your own access data or use the option of attaching Grafana to a directory service such as Active Directory.
Use various visualization options, such as bars, cakes or chart diagrams, to display your data in a way that suits you.
Quickly and easily define the period for which the data should be displayed.
Quickly share dashboards and views with colleagues to take a look at data together.
Display information not only graphically, but also supplement the view with direct values and names.
Grafana Consulting
We help you with the design, installation and integration of Grafana in your environment – for more power, know-how and peace of mind!
Power
We have been successfully supporting our customers in the operation of their IT infrastructures for many years. Whether it’s different industries, tools or operating systems – we’ve seen, operated and built it all. With extensive experience in best practices around Grafana, Prometheus, InfluxDB and other open source technologies, especially in the Linux environment, we are at your side with our know-how.
Know-how
We not only understand your IT systems and services, but also the big picture – the numerous aspects that make up the operation of complex IT infrastructures. In a world where IT is becoming increasingly complex and constantly changing, there is often a lack of time and personnel. This is exactly where we come in to provide you with optimum support.
Targeted reinforcement
As Linux generalists and open source experts, we are broadly positioned and deeply networked in the open source communities. With us by your side, you are never alone! Whether as an IT consultant, engineer, support or architect – we strengthen your team, relieve you and take over the work so that you can concentrate on the essentials.
Grafana training
Learn to visualize and analyze data clearly
In our Grafana training course, you will learn the basics of the Grafana Stack and everything you need for observability monitoring in larger and more complex environments. You will learn about the structure and functionality of the tools and consolidate your knowledge through practical exercises. You will also learn in detail how to get from Data Ingestion to your first alert.
Know-how
More know-how about Grafana
Infrastructure as Code (IaC): Grundlagen, Geschichte und Praxis mit Ansible und GitLab
Introduction The way in which IT infrastructure is provided and operated has changed significantly in recent decades. In the early years of system administration, everyday…
Observability vs Monitoring
The term observability is on everyone’s lips and is often touted as a modern solution to dusty old, static monitoring. All manufacturers offer it, all…
Icinga Web Module for Performance Data Graphs
After we forked the Grafana module for Icinga Web last year, we thought about whether there are other ways to graphically display Icinga performance data…
The Icinga Web Grafana module has found a new home
We are happy to announce that the Icinga Web Grafana module has found a new home! Originally developed by Carsten (Mikesch-mp), this module is a…
Katello as a package mirror for Icinga
This article is about setting up Katello as a package mirror for Icinga. Specifically, Icinga for Windows, Debian / Ubuntu, Red Hat Enterprise Linux and…
NIS 2 – The current status in January 2025
Since its adoption, the EU Directive NIS 2 (Network and Information Security Directive 2) has been a central element of the European cyber security strategy.…
Show users in MySQL
In MySQL, user management plays a crucial role in making database access secure and efficient. But how do you display existing users? In this blog…
Icinga 2 Security Release – November 2024
Critical error in the Icinga 2 core Today, November 12, 2024, the Icinga team has released a security fix that is classified as CRITICAL. The…
Data collection with the Support Collector
Last updated: 22.11.2024 What is the Support Collector and how does it work? The Support Collector offers an easy way to automatically record all important…
Questions & Answers
The most frequently asked questions about Grafana
What can you do with Grafana?
With Grafana, you can visualize data from various sources and display it in interactive dashboards to monitor important metrics and time series. It enables the creation of real-time dashboards with which users can analyze data from monitoring tools such as Prometheus, Elasticsearch or InfluxDB. Grafana is often used to track system performance, application metrics or business metrics in a clear and customizable way.
Is Grafana free of charge? What does Grafana cost?
Grafana offers a free open source version that covers many core functions such as creating dashboards and visualizing data from various sources. There are also paid plans such as "Grafana Cloud" and "Grafana Enterprise", which offer extended functions, more storage space and support. We will be happy to answer all your questions about the right model for you and the corresponding costs.
Is Grafana open source?
Yes, Grafana is open source and is developed under the Apache 2.0 license, which allows developers to view, modify and extend the source code. The open source version of Grafana offers many basic functions such as the creation of dashboards and integration with various data sources. In addition, there are commercial versions with extended features that are specifically intended for companies, but the core software remains freely available.
How do I install Grafana?
To install Grafana, download the appropriate installation package for your operating system from the official Grafana website or use package managers such as "apt" for Ubuntu or "yum" for CentOS. After installation, start the Grafana service with the command "sudo systemctl start grafana-server" and make sure that the service starts automatically at every boot. You can then access Grafana via a web browser by going to "http://localhost:3000" to start configuring and creating dashboards.
How do I start Grafana?
To start Grafana, you can use the command "sudo systemctl start grafana-server" on a Linux system after it has been installed. To ensure that it runs automatically at every system start, you can execute the command "sudo systemctl enable grafana-server". You then access the web interface via a browser at "http://localhost:3000", where you can log in and work with Grafana.
How does Grafana work?
Grafana retrieves data from various sources such as Prometheus, InfluxDB or Elasticsearch and visualizes it in interactive, customizable dashboards. Users can create queries to analyze specific metrics or time series data and display them in charts, graphs or other widgets. Through notifications and alerts, Grafana can also automatically warn at certain thresholds, making it a valuable tool for monitoring systems and applications.


