


Last updated: July 9, 2026 · Reading time: 2–3 minutes
Elasticsearch is running, Kibana is set up, but how does the data actually get into the stack? The answer lies in what are known as “Beats”: lightweight data collectors that run in the background and forward data to Elasticsearch. The easiest way to get started is with Filebeat and Metricbeat. This article shows you how to set up Filebeat for log files and Metricbeat for system metrics, and how to view both in Kibana.

Why use Filebeat first instead of Logstash right away?
Anyone getting started with the Elastic Stack will quickly face the question: Filebeat or Logstash? Both can collect and forward logs, but they are not the same.
I configured Filebeat first. With a small change to the YAML file, it’s up and running in no time. The effort required for Logstash, on the other hand, is significantly greater. A pipeline must be built, inputs and outputs must be defined, and Grok patterns must be developed and tested.
From my own experience, I’ve found that data transmission with Filebeat worked smoothly on a VM meeting the minimum requirements. With the combination of Filebeat and Logstash, however, the VM reached its limits.
Filebeat is therefore the right choice for getting started. When combined with Logstash, the two form a powerful alliance.
Filebeat logs sent directly to Elasticsearch
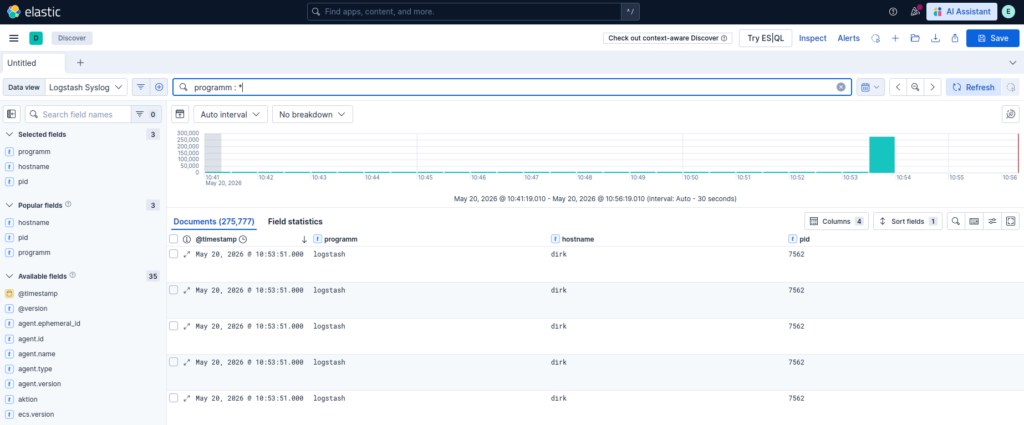
Filebeat reads text-based log files on the system and sends each new line directly to Elasticsearch. In the configuration, you specify which files should be monitored:
filebeat.inputs:
- type: filestream
  enabled: true
  paths:
    - /var/log/*.log
    - /var/log/syslog
- /var/log/auth.logFrom this point on, Filebeat runs silently in the background and doesn’t miss a single new log entry. The data is stored in Elasticsearch in a structured format and is immediately searchable.
Would you rather set up the Elastic Stack together?
Our consultants know the typical pitfalls!
Free Initial Consultation →
Filebeat, together with Logstash, is the next step
Once you’ve got the basics down, it’s worth integrating Logstash into the pipeline. Instead of sending data directly to Elasticsearch, Filebeat first forwards it to Logstash. Logstash processes the received data and transforms it into readable, structured results. Unstructured text is broken down into individual, analyzable fields before it is sent to Elasticsearch.
Metricbeat – Metrics-Based System Values
While Filebeat collects text-based logs, Metricbeat handles numerical values. CPU usage, RAM usage, running processes. Metricbeat retrieves these values at regular intervals and sends them directly to Elasticsearch.
After installation, a single command is all it takes to activate the system module:
sudo metricbeat modules enable systemFrom then on, all relevant system metrics are automatically fed into the stack.

Kibana – the visualization overlay
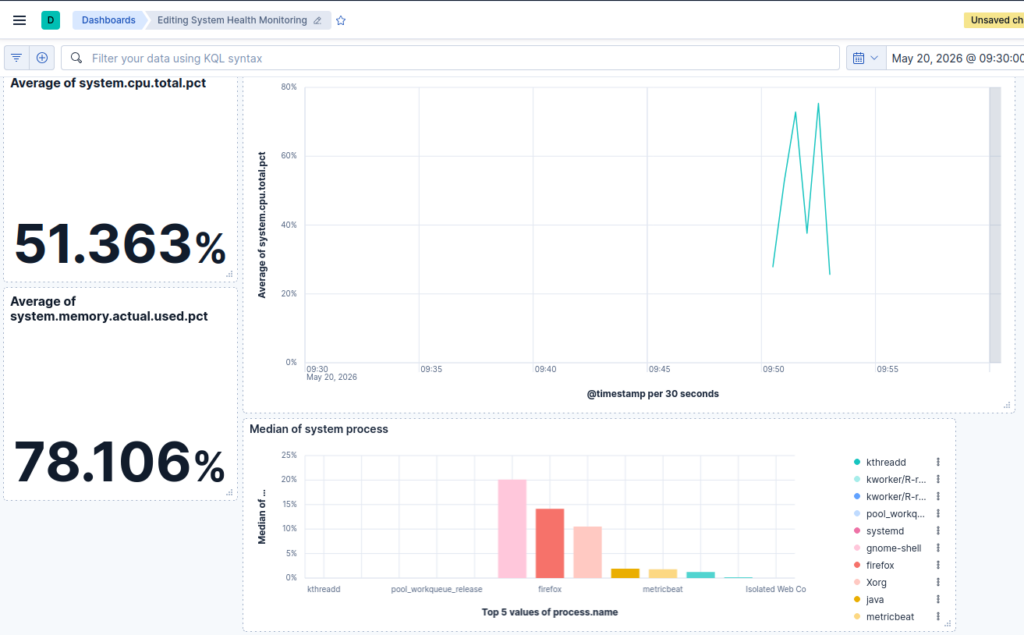
Kibana is the visualization layer of the stack. Here, you can view all the data provided by Filebeat and Metricbeat in custom dashboards. Whether it’s CPU utilization from Metricbeat data or filtered log entries from Filebeat.
A dedicated dashboard shows at a glance:
- CPU Usage: Live and Over Time
- RAM usage: current usage as a percentage
- Top Processes: Which Processes Generate the Highest Load
Conclusion
Filebeat and Metricbeat are the perfect way to get started with the Elastic Stack. Filebeat handles log collection, Metricbeat provides system metrics, and Kibana makes everything visible. If you need more control over data processing later on, you can add Logstash to the stack. However, Filebeat is the best choice for getting started: it’s simple, resource-efficient, and ready to use right away.
